Out?Lier
Windows program for testing outliers in data sets having normal or "close-to-normal" distribution
, and low number of observations
1. Specifications
1.1. Hardware: Min. 200 MHz .
1.2. Operating system: Tested on WinMe, Win2000 and XP.
1.3. Decimal setting in operating system: DOT (Control Panel/Regional Options: "UK" or "US"; Decimal symbol: "."). Unfortunately the comma as decimal symbol makes troubles (sorry for .fr, .it, .de, .sk and .hu users).
1.4. Maximum of data: 300.
1.5. Input
1.5.1. From comma delimited text files
Order the data in maximum three columns (see an example in the table below; suggested software: any spreadsheet calculator, e.g. Excel, Grapher or Origin). First line: three cells for the description of sample locality, measuring conditions, etc. The first record must contain something.
All other lines:
1st cell: data (obligatory, must be a number)
2nd cell: standard deviation of the data (can be empty, but it is practical to save this value, if the file will be opened by other statistical software).
3rd cell: ID of data point (can be empty)
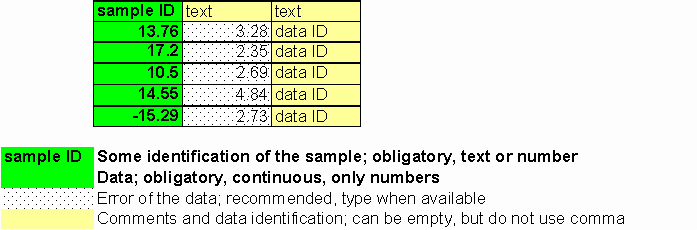
Export the table as 'Comma delimited' or as 'Comma Separated Variables' text file (extension: '.csv').
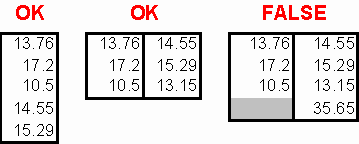
1.5.2. Paste from the clipboard
Copy an individual, continuous column or a complete block with numbers only, having no empty cells, and paste it into the running Out?Lier.
1.6. Output
The results of the tests are presented on screen and can be copied to the clipboard in table form. Paste these data into a spreadsheet calculator program.
2. Usage
2.1. Purpose
These four tests are used to detect outliers in univariate data sets. Tested samples are usually repeated measurements performed in similar conditions. The supposed reason of the aberrant behavior of an outlier is related to some non-systematic, unknown, technical factor that added the unexpected deviation to the scatter of the data which is typical for the given measurement.
2.2. What are the results?
The program shows the results of four most commonly used outlier tests developed for low number of observations. The T, R, Qx and g values are calculated by testing the minimum and maximum values of the sample. These values are compared with the critical values of the tables (or test algorithms). The tables of critical values are listed below. The results of the tests are in framed text fields in the main window of the program.
In the Grubbs and Dixon tests the 'Prob.' values indicate the probability that the tested data belongs to the supposed normal distribution determined by the whole population. Below 5% the pink coloring warns to the low probability. The Grubbs and Dixon tests have complex tables with critical values, thus the results can be expressed by probability ranges (e.g. P=5-7.5%). The IQR test has three categories at P=5%: 'within inner fences' = no outlier, 'mild outlier' and 'extreme outlier'. The Gauss g-test has only two categories: 'OK' and 'outlier' at P=5%.
2.3. What is important to consider?
Normality
These tests are developed to detect outliers in samples having normal distributions. If the investigated sample has some other, especially asymmetric distribution (e.g. lognormal), then these tests give false results!
Very low number of observations
I have serious doubts on the usage of these tests when the number of observations is below 10. Each test somehow requires the empirical distribution of the data and relates the most extreme value(s) to some parameter of the distribution. If the number of observations is very low (e.g. below 5) then the model is poorly constrained and the estimation is rather approximate.
Data with different precision
If the elements of the data set are determined by very different precision, then the application of the tests need special care. End-member of such a population can be just a consequence of lower precision resulting from the given measurement.
When real outlier --> then few
If more than 20% of elements of the sample is identified as 'outlier' then (1) assumption on the normality of the distribution was not appropriate, and/or (2) quality of data is not proper, and/or (3) tested sample is composite in character, the elements were derived from two or more independent populations.
2.4. Summary
- All statistical tests can be just a very coarse approximation when the number of observations is low.
- Handle the results of the tests only as suggestions; consider rejection only when the population fulfils the requirements of 2.3.
- A really good reason to remove data from the data set exists only when some independent sign or evidence (e.g. technical problem) is known on the given data having 'aberrant behavior'.
- If the four tests do not give consistent results then it is worth to study the equations of the tests and trace the reason of the inconsistency. In these cases the rejection of the tested data can be problematic.
3. Equations of the tests
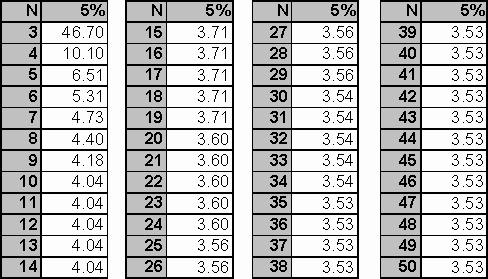
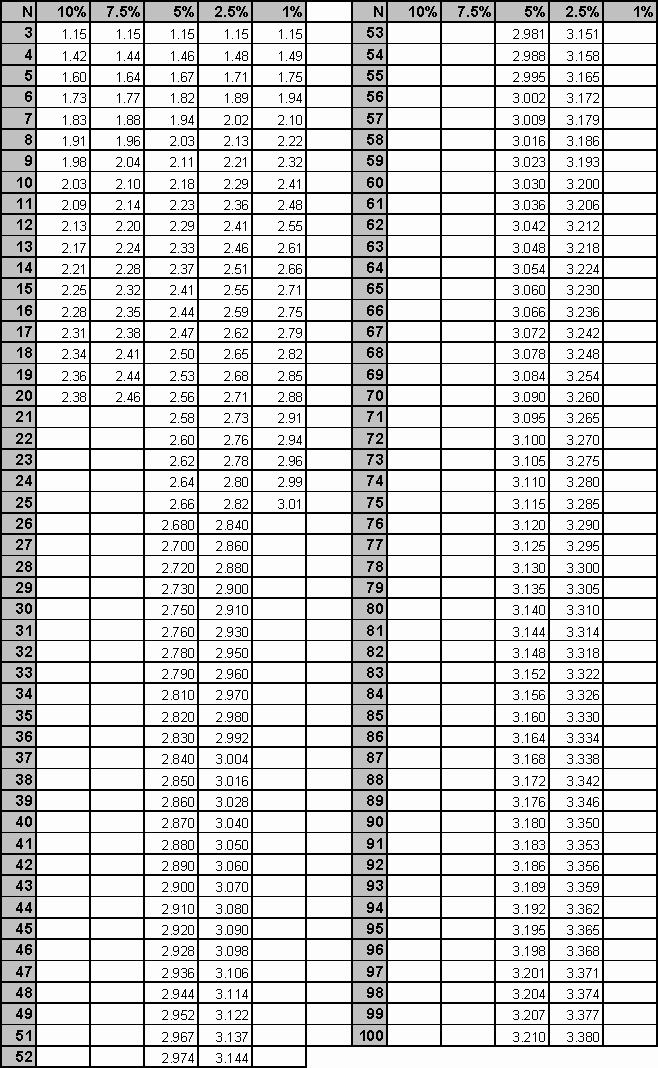
3.1. Grubbs test
The test is based on the difference of the mean of the sample and the most extreme data considering the standard deviation (Grubbs, 1950, 1969; DIN 32645; DIN 38402).
The test can detect one outlier at a time with different probabilities (see table below) from a data set with assumed normal distribution. If n>25 then the result is just a coarse approximation.
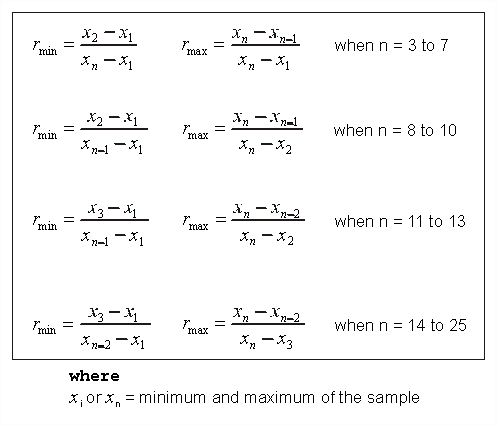
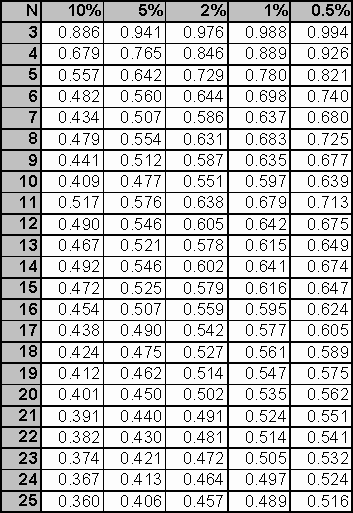
3.2. Dixon test
The test is based on the differences between the data members at the tails of the sample (Dixon, 1953). The test detects one outliers at a time (see the table of critical values below). Normal or close-to-normal distribution of the sample is required.
3.3. IQR (interquartile range) test
The test is based on the difference between the first and third quartile of the sample (Q1 and Q3). If the most extreme data has 1.5 times IQR distance from the next quartile then it is considered as 'mild outlier'; if the distance is over 3 times IQR then it is considered as 'extreme outlier'.
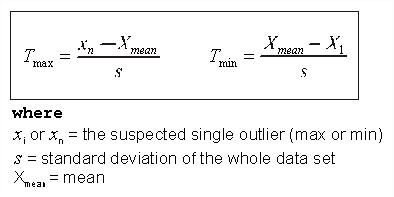
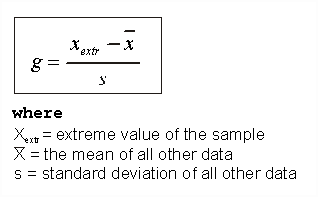
3.4. Gauss g-test
The test is based on the difference between the suspicious extreme value and the mean and standard deviation calculated from the rest of the sample (Szalma, 1984).
References
DIN 32645. (1994): Nachweis-, Erfassungs- und Bestimmungsgrenze. Beuth Verlag, Berlin.
DIN 38402, Teil 51. (1986): Kalibrierung von Analysenverfahren. Beuth Verlag, Berlin.
Dixon, W. J. (1953): Processing data for outliers. Biometrica, 9/1.
Grubbs, F. E. (1950): Sample criteria for testing outlying observations. Annals of Mathematical Statistics, 21.
Grubbs, F. (1969): Procedures for Detecting Outlying Observations in Samples, Technometrics, 11/1, 1-21.
Szalma, J. (1984): Mérési eredmények kiértékelésének alapjai (Introduction to evaluation of measured data). Tankönyvkiadó, Budapest.
Weber, E. (1980): Grundriss der biologischen Statistik, 8th Edition, Fischer, Jena.
Acknowledgements
The program was tested and the description was improved by Martin Danišik and Balázs Székely.
Tables
Grubbs' critical value table:
Dixon's critical value table:
Critical values of Gauss g-test: