 available
version: 1.u. (test)
available
version: 1.u. (test)
25 July 2004
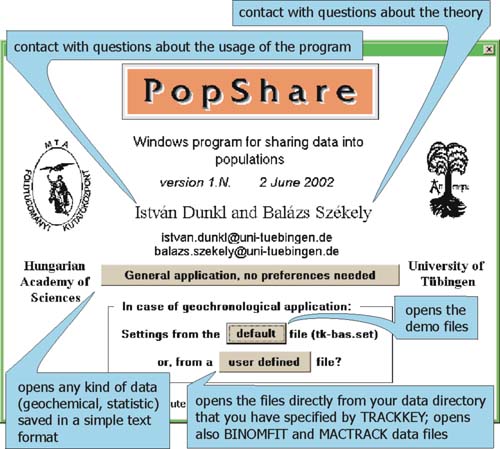
PopShare
POPSHARE is a Windows program for identification of components
in a mixture of data. It uses the SIMPLEX method for the best-fit search (thanks
for permission to L. Cserepes). The user can select both the distribution type
of the components and also the fitting algorithm.
The program is only in the test phase (beta-version). It is partly checked
and the description & 'Help' is still not complete. Contact us please, if you
find bugs or unstable points. It is a great help for testing our work.
System required:
- it is tested under Win 95, 98, 00, Me and NT 4.0,
- the country code and the decimal separator of Windows has to be set to dot (UK
/ US system),
- processor faster than 400 MHz recommended,
- screen resolution of at least 1024x768 pixels,
Status:
Freeware. In case of usage and publication we ask to cite this web page. We plan
to publish the description in a paper after the beta-test.
Quick start:
If you are interested in general application:
1a) Download the complete setup kit. Perform the setup.
2a) Press button 'General Application...' on the start window.
If you are aimed to use it to evaluate fission track data:
1b) Download the executable files. Copy the files into the TRACKKEY program directory.
2b) Press the 'default' button on the start window.
3) Open one example data file (POP......) from the TK-DATA directory.
4) Visit menu item 'Help / Tips for usage'.
5) Try to achieve fit on the cummulative plot (top right) by left and right mouse
clicks on the yellow stripes of rhomb plot (top left).
6) If the fit is already 'looks nice' (=red points and black line are in a proper
overlap) click the 'Calculate SIMPLEX' button.
Download the complete setup kit (test version
1.U.) - ca. 4.5 Mb, zipped
Download the example data - ca. 34 kb, zipped
The example data files are recommended for the start. Extract the files into a
directory called 'TK-DATA' and place it to drive C:\.
At download you are kindly asked to send an e-mail
to be a registered user and receiving information on the updates in the future.
--------------------------------------------------------------------------------------
A SHORT INTRODUCTION
The start window of POPSHARE:
--------------------------------------------------------------------------------------
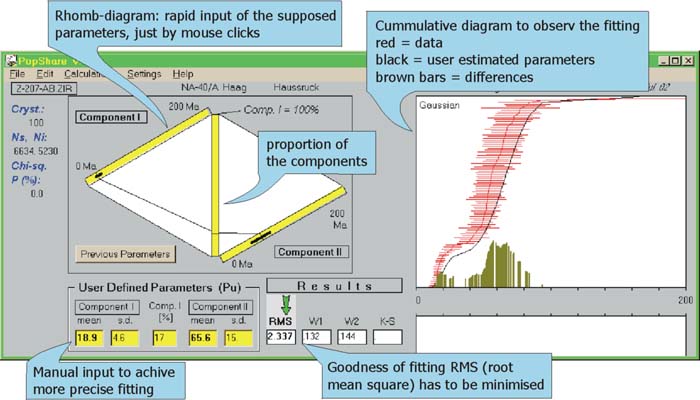
Data input and coarse approach by the 'Rhomb Plot':
--------------------------------------------------------------------------------------
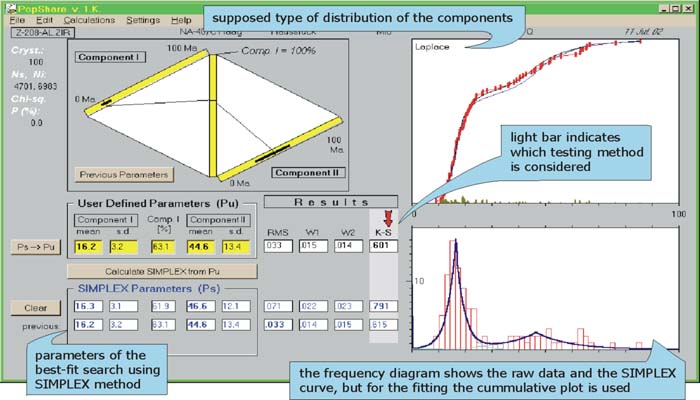
Result of SIMPLEX fit-search process:
--------------------------------------------------------------------------------------
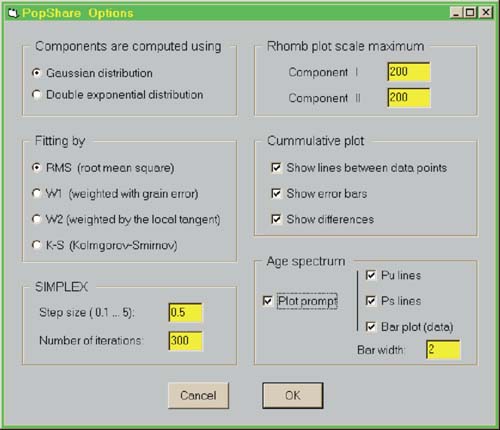
The option window:
--------------------------------------------------------------------------------------
Parameter map to visualize the reliability of the means of the two components
identified. The isolines representing the goodness of fit:
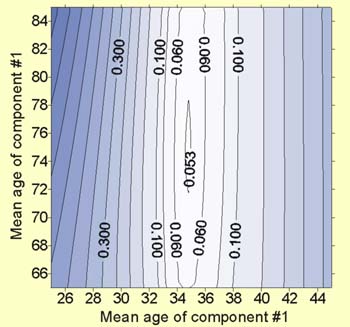
The 'Calculations / Two components Mapping' menu item exports
a table-file (with .CSV extension). From the first three columns of these table-files
you can draw isoline maps using any contouring package e.g. SURFER (Golden Software
Inc.).
In this example the parameter map shows a single minimum. One component can be
identified with high precision (~35 Ma) as the 'difference isolines' are rising
rapidly from the minimum in the X direction. On the other hand the second component
(with a mean of ca. 74 Ma) is badly estimated, the 'difference isolines' are hardly
increasing from the minimum in the Y direction.
Such 'maps' reflect how far can one goes in the interpretation of the mean values
of the component analysis, and the user should pay special attention to the possible
correlation between parameters.
--------------------------------------------------------------------------------------
Fitting to three components:
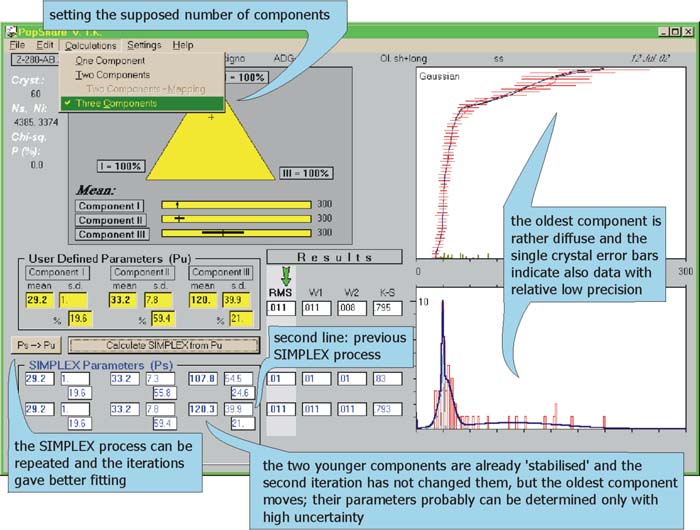
--------------------------------------------------------------------------------------
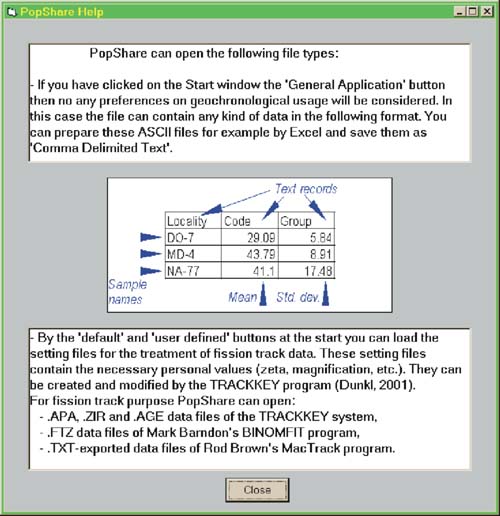
Data file formats:
Up to István Dunkl's homepage.